
Math and art may appear, superficially, like two disparate fields, but they've been in conversation for millennia. One recent example of the synergistic possibilities between the two comes from Canadian scientists Christian Ilies Vasile and Martin Kryzwinski. The pair have utilized the data visualization software Circos to create beautiful and colorful visual representations of mathematical constants π (pi), φ (phi), and e using transition probabilities and color-coded digits on Archimedean spirals.
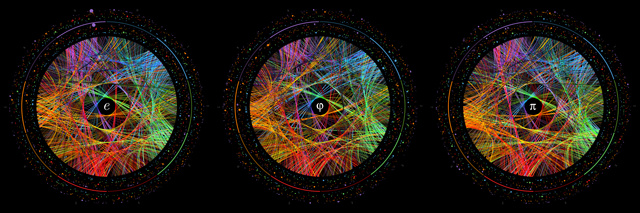
Progression and transition for the first 1,000 digits of π, φ and e
Given the endless nature of π, φ and e the task of representing them visually in a simplified form could seem daunting. However, thanks to new infographic technology and the natural form of the Archimedean spiral understanding pi's sequencing (for the layperson anyway) becomes a thing of beauty rather than outright confusion—the technicolored vastness evoking an almost spiritual quality.
For the technical deets on how the pair created the visuals, check out the project page on Kryzwinski's site.

Progression of the first 10,000 digits of π

Progression and transition for the first 1,000 digits of e

Progression and transition for the first 2,000 digits of e

Distribution of the first 3,422 digits of π mapped onto a red-yellow-blue Brewer palette and placed as circles on an Archimedean spiral

Distribution of the first 123,201 digits of π mapped onto a red-yellow-blue Brewer palette and placed as circles on an Archimedean spiral
[via Visual News]
This post originally appeared at the Creator's Project.